- AI capex plans have crossed a threshold where even strong earnings no longer offset valuation and return-on-investment concerns. Nasdaq and SaaS names sold off sharply as AI disruption and capex intensity forced valuation reassessment.
- Cross-asset divergence widened, with Japan and select value markets outperforming.
- US labour-market data is deteriorating at the margin.
- Central bank divergence is increasing, with Australia turning more hawkish while the BoE moves closer to easing. The RBA resumed hiking, signalling inflation persistence and raising the probability of at least one further increase. The ECB remains firmly on hold with no near-term shift expected.
- Precious metals volatility is being driven by leverage, margin mechanics and speculative pockets, not a breakdown in structural demand. Central-bank-driven demand for gold remains intact and dominant. We see this as anchoring a multi-year bull case.
- The US dollar rebound looks corrective rather than structural, with debasement and diversification trends still intact.
- Japan’s equity rally reflects a genuine macro and corporate regime shift. We see scope for continued outperformance on improving earnings revisions, governance reform, and policy support. The government debt is manageable – we dive into the details.
Report spotlight
- Betashares Japan ETF: Japan’s structural re-rating is being driven by fiscal discipline, reflation, governance reform and rising ROE, and HJPN offers clean equity exposure while stripping out yen volatility — BUY.
- Sumitomo Mitsui Financial Group: Bank of Japan normalisation, strong earnings momentum, disciplined costs and accelerating capital returns support a sustained re-rating despite near-term consolidation risk — BUY.
- Apple: Operational execution and ecosystem strength remain exceptional, but the valuation leaves limited scope for multiple expansion, favouring patience for new capital — HOLD.
- Genesis Minerals: Record gold prices are driving supernormal cash flows and balance-sheet strength, but stay on hold amid elevated precious-metals volatility — HOLD.
- Whitehaven Coal: A confirmed technical breakout, improving cost performance, and structurally constrained metallurgical coal supply underpin further upside toward prior highs — BUY.
What to watch next week
- Follow-through in US labour data
- Stability and volume patterns in gold/silver after the margin-driven flush. How base metals fare.
- Japanese election outcome and confirmation of policy continuity.
- Market pricing of an additional RBA rate hike. Earnings season is creeping nearer.
- Whether tech and SaaS selling pressure broadens or stabilises.
The FatWrap ties it all together.
Every Friday in our FatWrap, we connect the dots between what happened across rates, currencies, commodities, and equities. We attempt to distil the week’s noise into signals. Which policy shifts matter, which geopolitical moves have teeth, and where the real catalysts are hiding. Then we deliver a focused subset of ideas (could be stocks, FX, ETFs, commodities) to finish your week with clarity and a concrete game plan. A much larger investment universe is available to peruse online at your leisure in our Members area and via our Daily notes.
I also use this space to pressure-test our thinking against the investors who’ve earned credibility the hard way. When a macro fund manager maps shifting capital flows, when a bond veteran calls a turning point, or when a geopolitical analyst translates policy into tradeable incentives, I treat it as sparring material. Not gospel – raw input to interrogate, translate, and integrate where it sharpens our edge. The goal isn’t to outsource judgment; it’s to stress-test it, so you get a clearer read on what matters and how to position.

Global Markets
Global markets faced headwinds as multiple pressure points converged: soft US jobs data and a tech sector selloff, alongside lingering impacts from the Kevin Warsh Fed Chair nomination, and the ongoing hangover from the recent precious metals margin hikes by the CME. Volatility was back on deck, with a surge in the VIX on Thursday.
We have seen quite a lot of divergence over the past week (through to Friday morning, Feb 6), with Japan’s Nikkei outperforming – we do a deep dive into Japan later in this issue. The UK’s blue-chip FTSE 100 has also been solid, despite choppiness and some big moves in resources; the ASX200 held up reasonably well (Editor’s note: As we were going to print with this, the Australian market was following the weak lead from Wall Street, sharply lower). The Nasdaq’s sharp fall was notable, and we discuss the reasons below.
 Tech Titans are All-in on AI!
Did you think that tech was already in on AI due to stratospheric spending? Well, it seems not. Google parent Alphabet guided for 2026 capital expenditures of $175 billion to $185 billion (wowzers!), with the top end more than double the 2025 spend, to expand AI compute capacity for Google DeepMind, meet “significant” cloud customer demand, and improve the user experience and advertiser ROI across Google services.
The incredible proposed AI-related spending overshadowed an otherwise impressive report for Alphabet shares to finish a slight -0.6% lower on Thursday (the day after results were released). Alphabet actually fared better than most tech peers, though that was a low bar on Thursday, when the sector was bleeding. The real issue is that AI spending has reached such staggering levels that even true believers are starting to ask the uncomfortable question: when do we actually see the returns?
Make no mistake, we think AI will be transformative. But there’s a difference between “transformative in five years” and “justifies current valuations today.” Right now, markets are struggling with that distinction. The rotation out of tech and into value and defensive sectors, alongside small caps, suggests this reassessment has further to run.
Amazon added fuel to the fire after the closing bell on Thursday. The shares slumped in after-hours trading after a mixed fourth quarter, but the main shock was its step up in spending. The company lifted its 2026 capital expenditure outlook to about $200 billion, far above what analysts had expected and up from roughly $131 billion in 2025, as it pours money into data centres and infrastructure. The capex escalation lands amid an AI arms race, with all the major players flagging sharply higher 2026 investment plans.
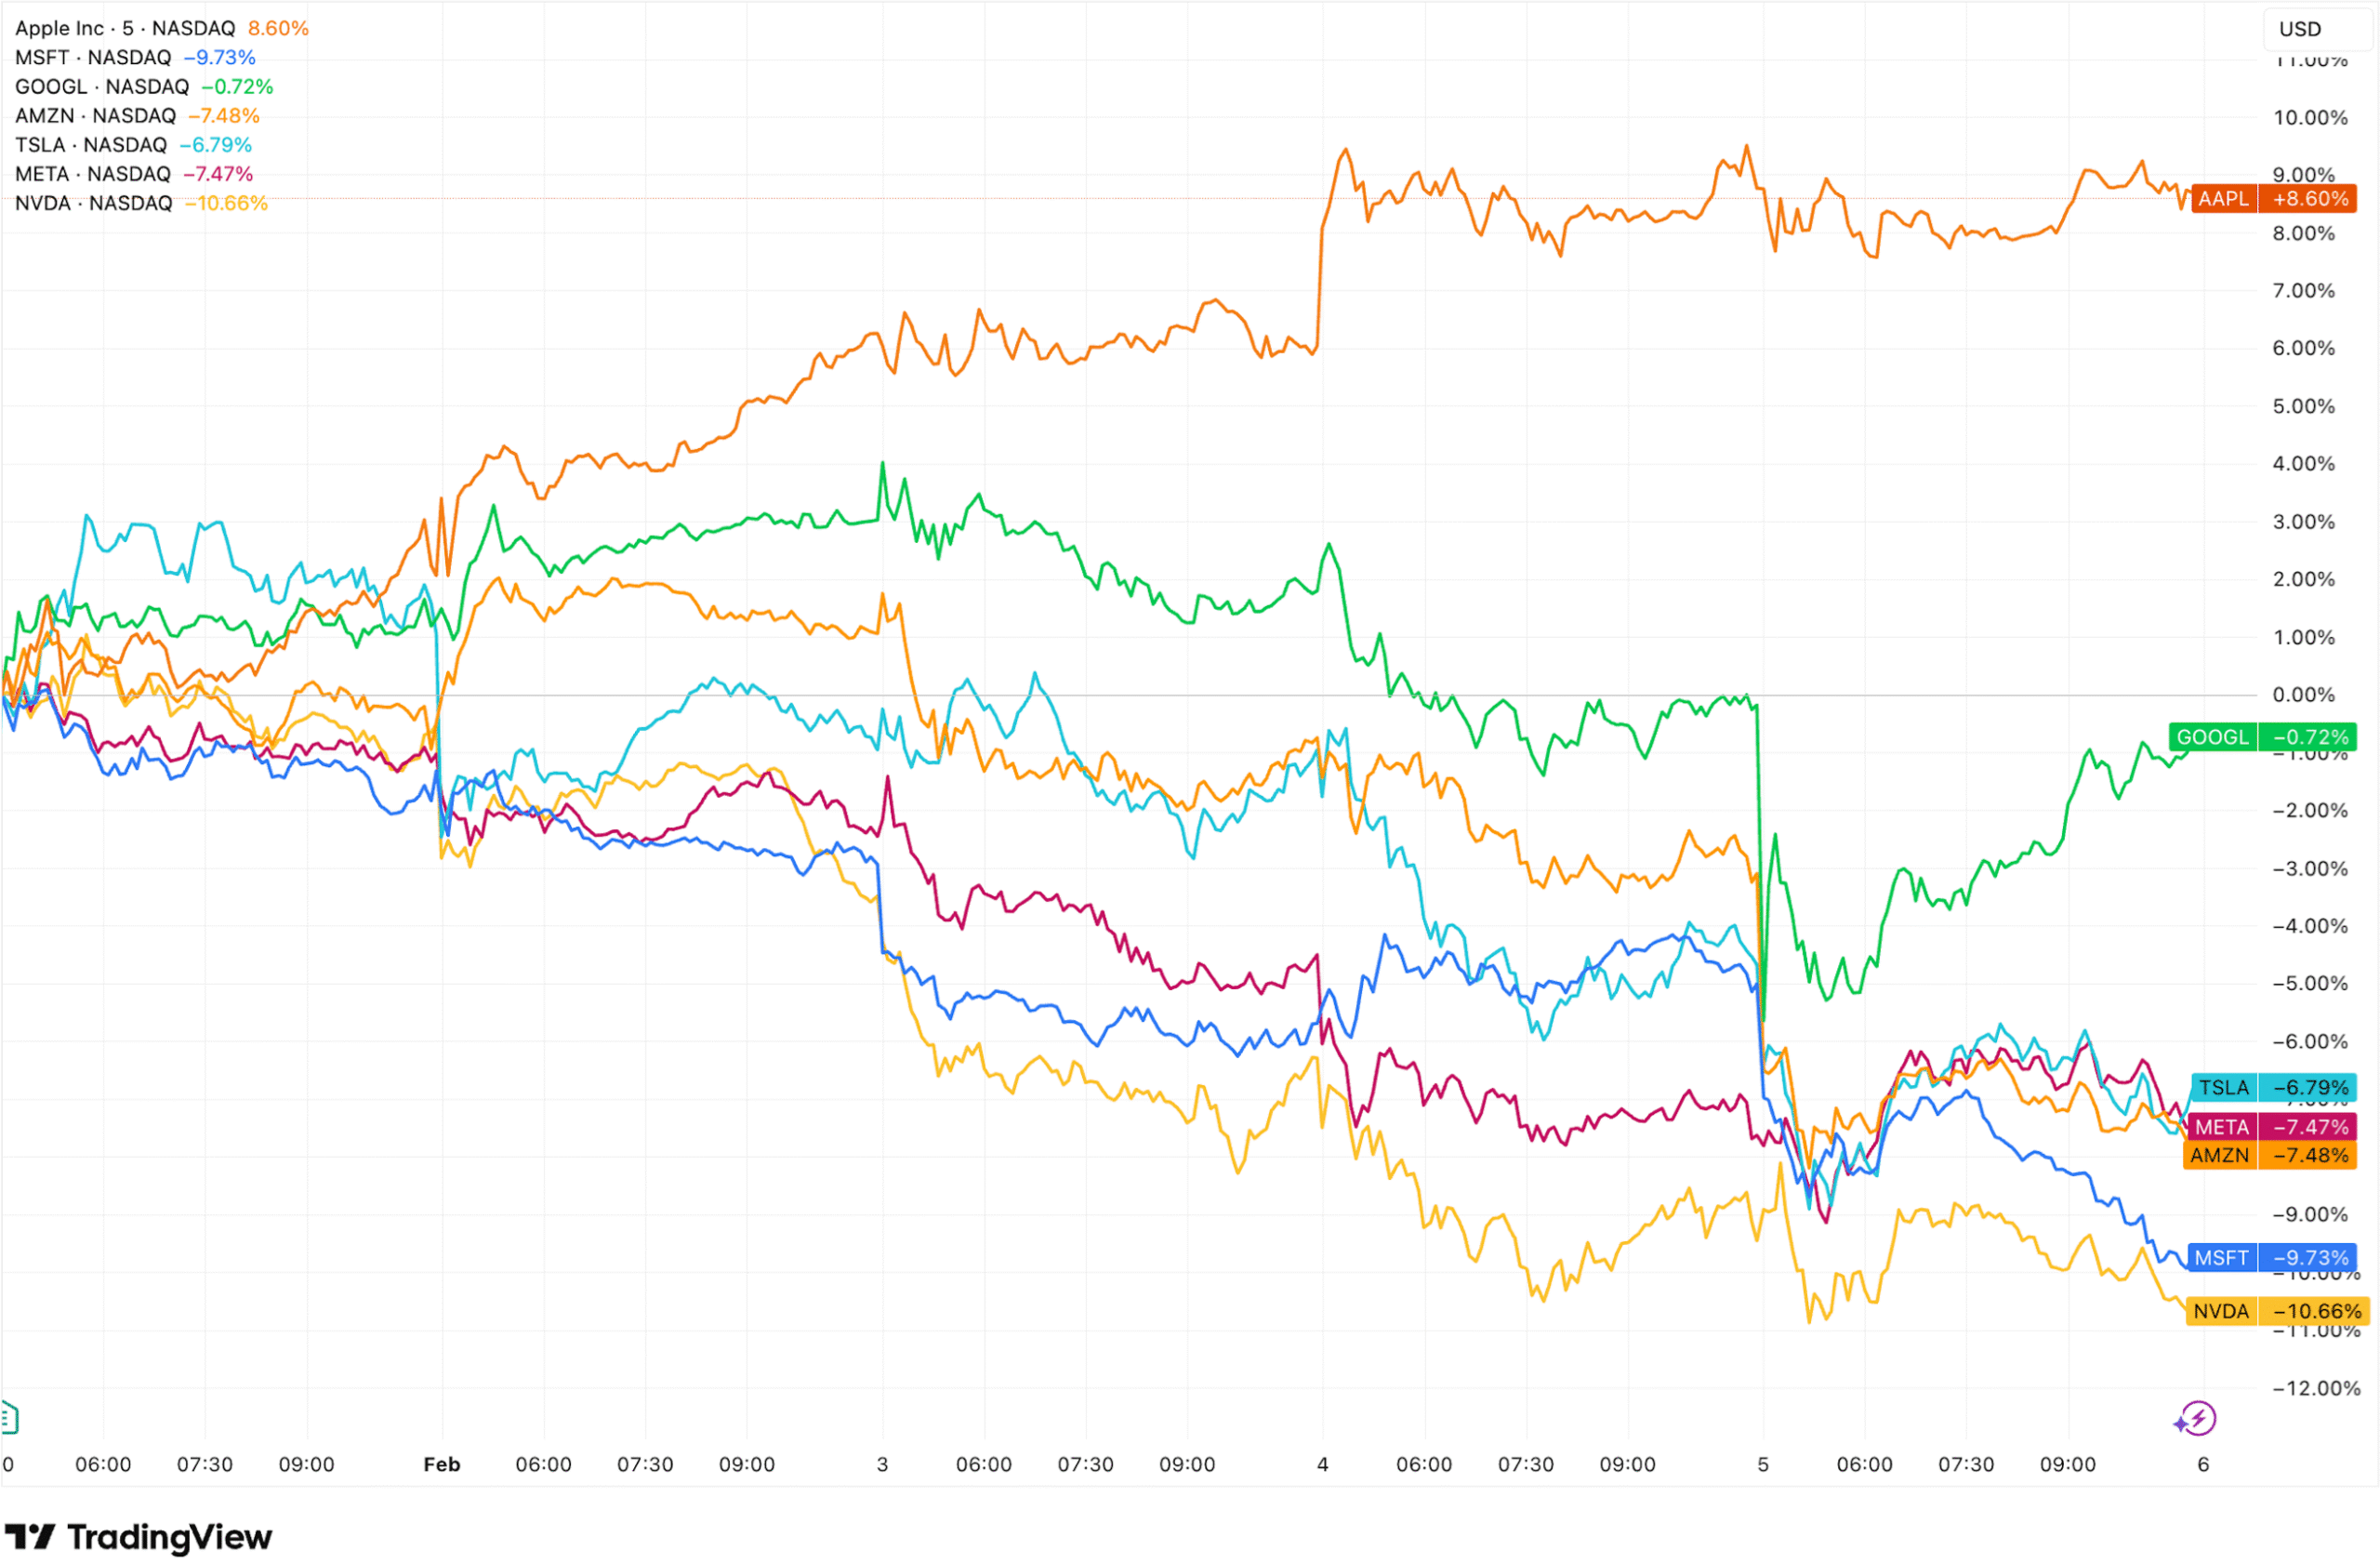
Amazon’s quarterly results were otherwise close to forecasts. Revenue beat expectations, while earnings per share came in slightly light. AWS and advertising revenue each topped Street expectations, and net income rose from a year earlier. Shifting investor appetite towards AI over the past week (5 trading days) can be clearly seen below, as investors snapped up Apple and rotated from Nvidia and others. Our research team has updated our view on Apple – see a snapshot below and the full report in our Members area.
The “SaaSpocalypse”

The SaaS sector faced a sharp sell-off during trading week, dubbed the “SaaSpocalypse”, erasing nearly $1 trillion in market value across software and services stocks with names like Salesforce, ServiceNow, Intuit, Adobe, Atlassian, RELX and many others selling off sharply. This was triggered primarily on Feb 3 by Anthropic’s release of tools to assist in automating tasks like legal contract review and data analysis, sparking fears of existential disruption to traditional SaaS models. Agentic AI could eventually displace many business models that are app-based, and this was front and centre on investor concerns this week. Many companies will adapt and survive, of course, but the market is right to be concerned about which will fall by the wayside and isn’t being particularly discriminating. This will surface some opportunities for patient investors.
US Labour Market Cracks Widen
The macro tone darkened on Thursday as labour-market data pointed to softening demand for workers. Challenger, Gray & Christmas said U.S. employers announced 108,435 layoffs in January, the highest January total since the global financial crisis, while initial jobless claims for the week ended Jan. 31 rose more than expected, and December job openings fell to 6.542 million, down 386,000 and the lowest since September 2020, versus expectations of 7.2 million. Hires and total separations were little changed at 5.3 million each, quits edged up to 3.204 million, and the quits rate held at 2.0%, suggesting workers are still leaving jobs voluntarily at a steady clip even as openings retreat.

Central Bank Divergence
Australia’s RBA hiked by 25bp to 3.85% – more on that later. The Bank of England held at 3.75%, but in a much closer 5-4 vote than expected, signalling cuts are coming. The ECB stayed put at 2% for the fifth straight meeting, with about 85% of economists expecting no changes through the rest of 2026.
The Precious Metals Hangover Continued, but the Structural Case is Intact
After staging a partial rebound mid-week, gold fell again on Thursday and was heading further lower on Friday morning (Australian time), while silver extended a brutal decline. Volatility is still elevated in precious metals following last Friday’s big selloff. However, I still am of the view that the acute phase of the selloff is now over. Gold is looking more stable, and the other PGMs should soon also follow suit.
In our view, the structural case for precious metals remains intact; however, investors should brace for more volatility. For investors who’ve been waiting to add exposure, there will be opportunities, so tune in for our daily and weekly correspondence for recommendations.

The Big Picture
Despite the rally and the recent rebound in the greenback that followed the appointment of Kevin Warsh over the past weekend and early this week, I still see downward pressure reasserting itself this year. which markets on balance see as a responsible choice. Mr Warsh has close family ties to DJT. The President has extensively criticised incumbent and outgoing Chair Jerome Powell since he took office. I don’t think DJT would select a replacement who’s not going to lean dovish this year, given the importance of lower rates this year to the US economy and housebuilding sector. The midterm elections will be held in November and could be defining for Trump’s presidency if control of the upper/lower houses is lost.
The US dollar index rebounded again on Monday, but it still faces significant overhanging technical resistance headwinds.
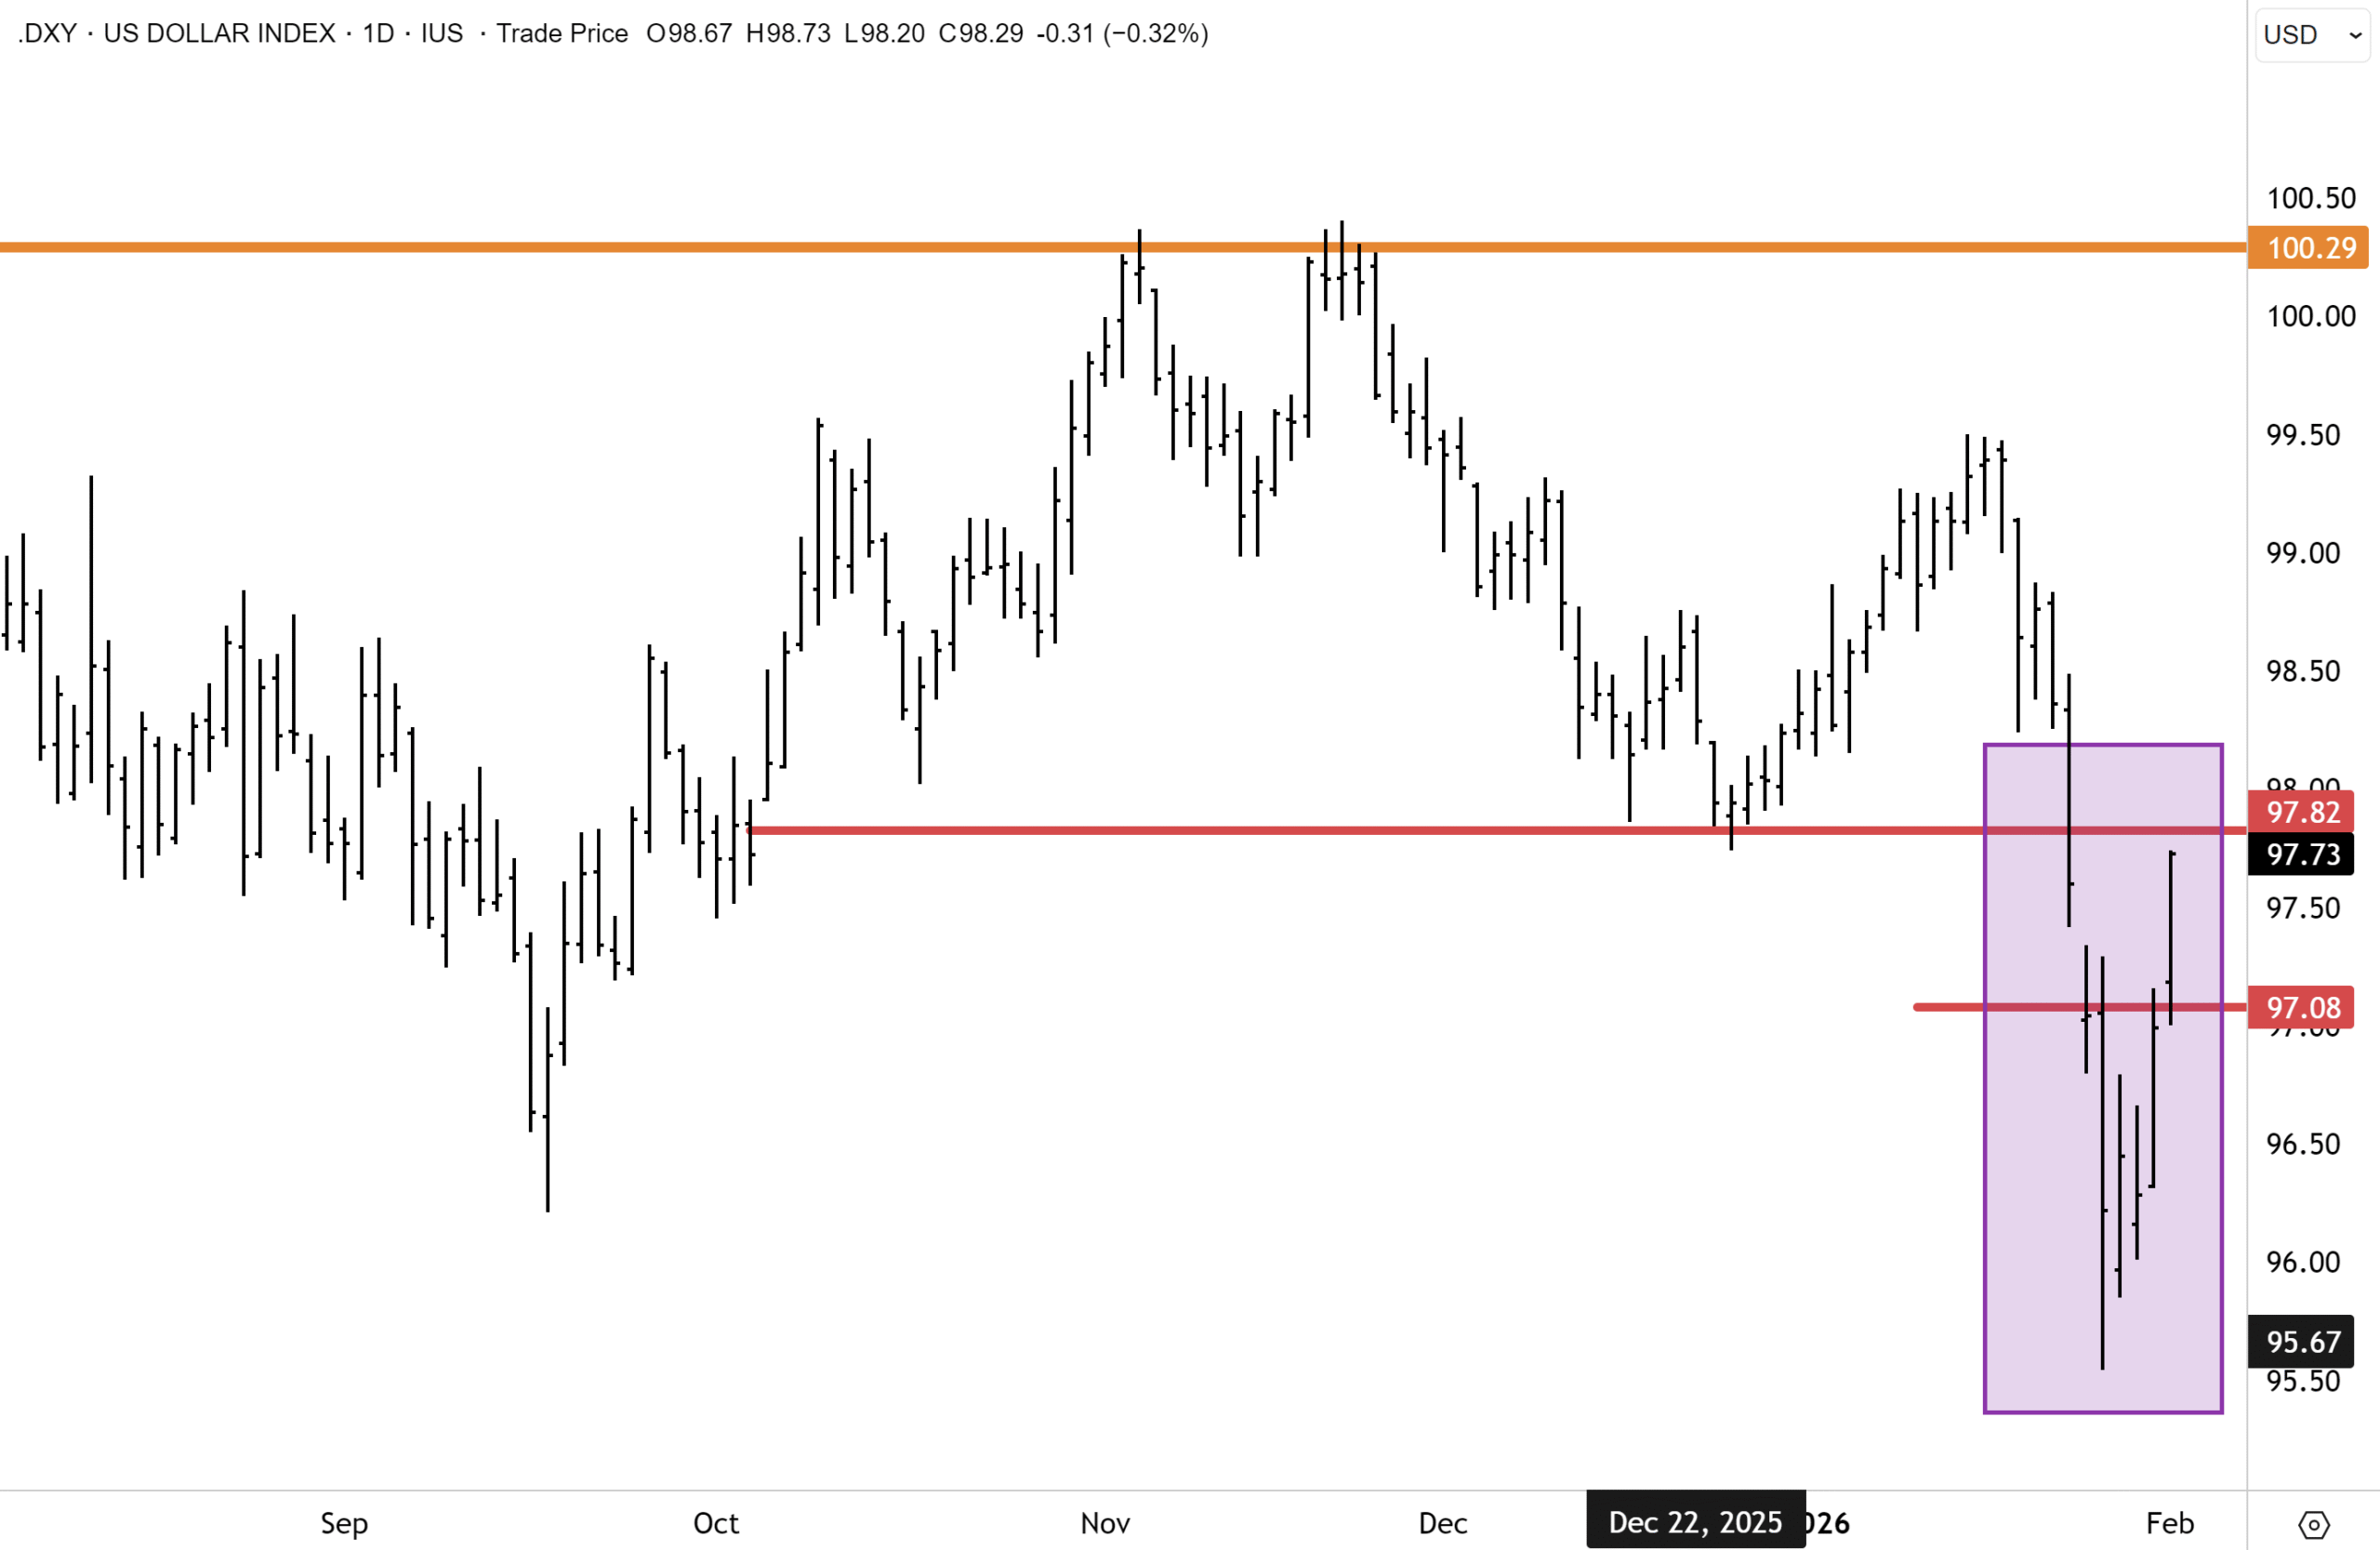

JP Morgan maintained their bearish outlook for the dollar this week and noted this week that “some consolidation is possible, but underlying drivers remain intact…This is not a ‘Sell America’ moment; it’s about diversification with EM the main beneficiary of equity rotation.” With the recent pushback on the US rate cut narrative, the dollar received a bid, but I don’t anticipate this to interrupt the “debasement” and “de-dollarisation” trends that were underway in January.
Goldman Sachs reiterated their bullish view on gold over the weekend following the big drawdown. Goldman, in a weekend note, said that “gold has capped off a huge 2025 rally with a blazing start to 2026. While prices declined on Friday, Goldman strategists believe the precious metal would continue to rise. “The main driver of the move has been global central banks’ shift from the US dollar to precious metals…These [precious metals] are tiny markets compared to global stocks or fixed income, so the smallest change in demand makes prices go parabolic.”
The investment bank noted that “only about 5% of the world’s gold is currently held by speculators. If a central bank decides they want to pivot away from the dollar and own more gold, that is going to move the price quite violently. Which is what we’re observing. We therefore remain skeptical of arguments that gold is currently being driven by speculative mania. We think this is a multi-decade trajectory.”
This sums up my view as well, and trying to trade short-term swings in gold and precious metals is flawed as a strategy. In my opinion, we need to focus on the bigger picture and the primary uptrend, which could endure for many years. Goldman cited that “gold ‘barely moved’ from 2010 to 2020 even as growth-oriented stocks surged, which means the recent move can partially be categorised as a catch-up. Do we expect gold to continue to appreciate exponentially as it has? No. But we’re not fussed about there being a lot of froth when it comes to precious metals. We recommend that investors own both equities and gold (rather than equities and fixed income) in a refreshed version of a barbell portfolio.” This is a good point, and I would also add that precious metals spot prices significantly eclipsed even some of the most bullish forecasts for this year. Even after the drawdown on Friday, many gold and PGM miners are generating ‘supernormal’ profits and free cash flows at current spot prices. As volatility recedes after Friday’s deleveraging event, investors will refocus on the fundamentals.
Morgan Stanley strategists said this week that “gold had surpassed our $4750/oz 2H forecast, but we don’t think prices have peaked, with geopolitical risks, positive signals from central banks, and ETF buying. We highlight our bull case: $5700/oz for 2H. Silver price momentum looks strong, with physical premiums in Shanghai highlighting tightness.”
Central bank buying is likely to re-emerge after the reset in gold prices (which were looking more appealing again on Friday morning). For example, Poland is now targeting an absolute tonnage of gold for its central bank holdings, rather than a share of reserves. Other central banks are likely to follow. Meanwhile, precious metal ETF buying should remain supported if the dollar weakens and the Fed cuts rates further later this year (our base case).
Morgan Stanley said that “a structural shift in central bank gold buying took place in 2022, and it is increasingly clear that gold is the USD’s biggest challenger within reserves, growing in both value and volume terms. We have historically assumed that central banks mainly think of gold holdings as a percentage of reserves, implying less buying as prices rise. However, with Poland now targeting 700 tonnes of gold (from 550 currently), instead of its previous ambition of 30% of reserves, this may be changing. If this is reflective of other central banks’ thinking, it could suggest price may become less important in purchase decisions, supporting continued elevated buying.”
Last Friday’s selloff was driven by speculators and leveraged traders with futures positions caught out by higher margin requirements at the Chicago Mercantile Exchange. It had little to do with central bank selling. I expect a bid to soon re-emerge in the gold market, with the drop in prices likely to solicit further central bank buying.
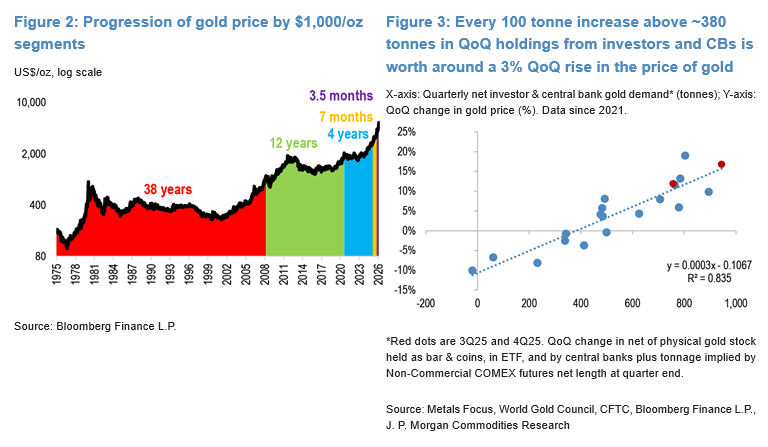
JP Morgan holds a similar view on gold and made some interesting observations this week. “It’s all about commodities to kick off February. Where January started the year on the front foot, February finds itself on the back foot. The Bloomberg Commodities Index opens today down >3%, which, if not for Friday’s selloff, would have been one of the 2 largest in the past 3 years. Precious metals are seeing follow-through to their historic Friday losses this morning, with the group down anywhere from 1-5% this morning. For base metals, the move is more subdued, with copper down just a percent or so. Most topical for us is an update to our (already bullish) forecast for gold prices.”
The JP Morgan commodities team actually raised their year-end target for gold to $6,300. JP Morgan noted that “our team remains “firmly bullishly convicted” in gold. Underpinning this view is stronger-than-expected demand from central banks and investors, compared to projections from our initial framework last May… Over 2H25, demand from investors and central banks came in at 944 tonnes and 757 tonnes in 3Q25 and 4Q25, respectively, or between 150-250 tonnes higher year on year. The numbers are large. Notional investor and central bank gold demand in 3Q25 and 4Q25 averaged approximately $103 billion ($105 and $101 billion, respectively) at average gold prices for the respective quarters, roughly $40 billion above the average of 1H25 which formed the baseline for our original $6,000/oz framework.”

The tail doesn’t wag the dog. Central bank and sovereign wealth fund capital flows into the physical gold market dwarf speculative trading in futures markets. When it comes to the gold market, the “dog clearly wags the tail”, which is really an analogy for the deeper capital flows into gold (and out of the dollar and US and other government bonds) that are really at the centre of the gold market. These deep secular trends are now well entrenched, and the speculative flush out on Friday will not impact these deep-seated capital flows, in my opinion.
 Source: JP Morgan
JPM also noted that “It’s worth flagging some of the technical indicators of “how we got here.” While many are chalking the [Friday] sell-off up to a reaction to the Warsh-nomination, there are some derivative dynamics at play… rising open interest, ETF flows, futures positioning & retail participation have all served to create technical dynamics that may not be fully appreciated.” JPM believes the selloff in gold has created a buying opportunity.
Technically, the gold showed encouraging signs of stabilising on Monday. After touching an intraday low of $4,387, gold rebounded off the October highs and staged a sharp upward reversal, rising quickly back to $4,700oz at the time of writing. This upward dynamic was a positive outcome and points to the acute selling and drawdown that got underway on Friday, losing momentum. I expect prices to begin settling down now and for gold to enter a multi-month consolidation – similar to what occurred following the October drawdown last year in a range between $5,000 on the topside with the $4,600 and $4,500 levels as key supports. After the dust settles, gold will resume upward momentum in my opinion and likely retake the $5,000 level later this year. Our outlook might be conservative! What resonated this week was JP Morgan lifting their price target to $6,300 for December ’26!

For silver, the Friday drawdown was not unexpected, but we concede the technical setup on the charts is messier than gold. With silver spot prices overshooting to $120oz, the spike higher had all the hallmarks of a short-term squeeze in the physical market and heavy speculation in futures. I expect silver to now settle down and enter a multi-month consolidation phase and establish a new range with the $65/$70 a potential support floor and the $90 level on the topside, a likely short to medium term cap.
However, it is important to remember that silver rising above $90oz and $120oz surpassed even the most bullish commodity strategist forecasts at the beginning of the year. Additionally, similar to pure play gold producers, at $65/$70 spot, silver miners are also generating significant free cash flow and revenues. Silver miners steadied on Monday, which was notable.

JPM said that “the picture [for silver] is a bit less clean. Our team notes that relative pricing in India and China more recently were signalling the emergence of stronger investment demand, which sustained the risk of a continued run higher. However, with better physical liquidity ex-US, we see growing warning signs that risked a sharp correction. The first leg of this violent pullback has come, though in a small and volatile market like silver, we believe the risk of an overcorrection runs both ways. Without the central bank buying that underpins the gold thesis, silver is a bit more vulnerable to a “deeper shakeout.” In turn, we see risk for a move back higher in the gold to silver ratio in the coming weeks.”
JPM makes some good points. But it is worth highlighting that silver spot eclipsed even the most bullish forecasts, and I see the silver miners consolidating at much higher price levels than what was seen after the October drawdown.
The Resurgent Sun

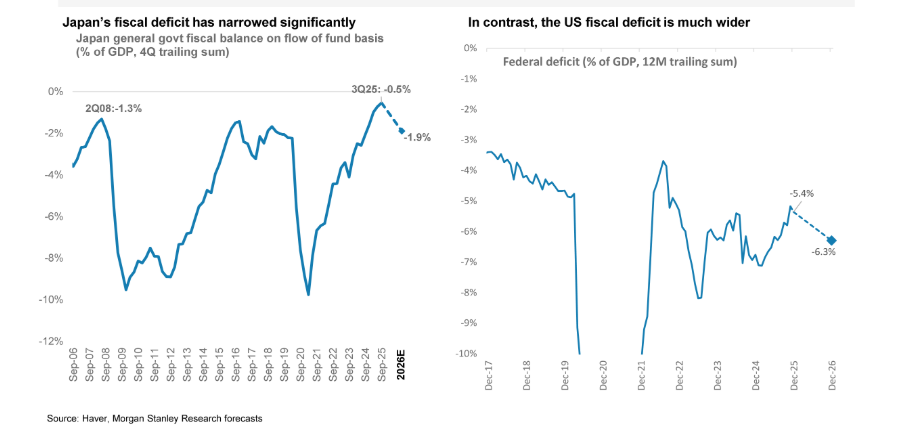
Japanese benchmarks have reached record highs as of February 2026, but the current momentum is far from exhausted. Fears regarding Japan’s high debt-to-GDP ratio are overblown in our view. The fiscal deficit has narrowed to -0.5% of GDP, the healthiest gap in decades. When contrasted with a ~6% federal deficit in the United States, Japan’s fiscal discipline becomes a powerful, often overlooked differentiator. In our view, the recent steepening (albeit very rapid!) of the yield curve and the rise in bond yields should not be viewed as overly alarming, though we continue to watch for any liquidity stress. Instead, overall, these are the hallmarks of a country finally purging thirty years of deflation and undergoing a step change in improved corporate efficiency.
Japanese earnings revisions are trending positively, fundamentally signalling that the Japanese corporate machine is ticking over positively and on a favourable basis to many international peers. Capital tends to shift toward a market where earnings growth is positive. There is a new element emerging in the mix, “Sanaenomics”. Prime Minister Sanae Takaichi’s administration has fundamentally rewritten the Japanese macro playbook with her “proactive public finance” stance.
The ¥21.3 trillion stimulus approved in late 2025 was not ‘bridge to nowhere’ money, but rather quite targeted. Household support of ¥11.7 trillion underpins consumption, while ¥7.2 trillion is aimed at strategic sectors, notably defence, semiconductors and “Physical AI”. By effectively subsiding corporates’ capital expenditure, these companies will see increased return on equity/invested capital.
With the February 8th snap election likely to deliver a strong mandate, the market is pricing in a “continuity premium.” A decisive victory for the LDP-JIP coalition will effectively clear the political runway for the next two years, allowing the Takaichi administration to lean into its reflationary agenda without the constant overhang of an imminent leadership challenge.
Meanwhile, Japan is at the beginning of a cycle where wage growth is flowing through sufficiently to increase ‘real wages’, giving companies the “pricing power” necessary to expand margins even as the Bank of Japan normalises the policy rate.
From a corporate governance perspective, we have moved beyond the “compliance phase” of the Tokyo Stock Exchange reforms to Capital Efficiency 2.0.” The record-breaking ¥115 trillion cash pile held by Japanese corporates provides firepower for share buybacks and higher dividends. After hitting a record ¥18 trillion in 2024, buybacks were trending higher in 2025, and when the final figures are released, we expect them to be materially higher. We are also seeing a pick-up in M&A, management buyouts, and strategic divestments designed to maximise Return on Equity (ROE). This structural change in the market is surfacing hidden value, making the Nikkei’s journey toward the 54,000–56,000 range look not like a rational re-rating.
On this front, we note that the Nikkei is only around 25% above the 1989 record highs.

We have seen a few commentators suggest that means Japanese equities are again expensive. That is not the case. Yes, Japanese equities were in a bubble in 1989, trading at an estimated 60-70x forward earnings. As of early February, the Nikkei is trading around 24x, but the Topix is at below 18x. Note that the price-weighted Nikkei can be more easily influenced by a small cohort of the largest stocks. The Topix offers a better representation of the value on offer.
Let’s address another aspect we view as somewhat misunderstood. Yes, Japan’s debt-to-GDP ratio is very high. However, after peaking in 2020, the ratio has been moving lower.
The “Denominator Effect”
For the first time in decades, Japan’s nominal GDP is growing faster than its debt issuance. This means the “denominator” of the debt-to-GDP equation is finally expanding, causing the ratio to actually decline.
 Source: Morgan Stanley
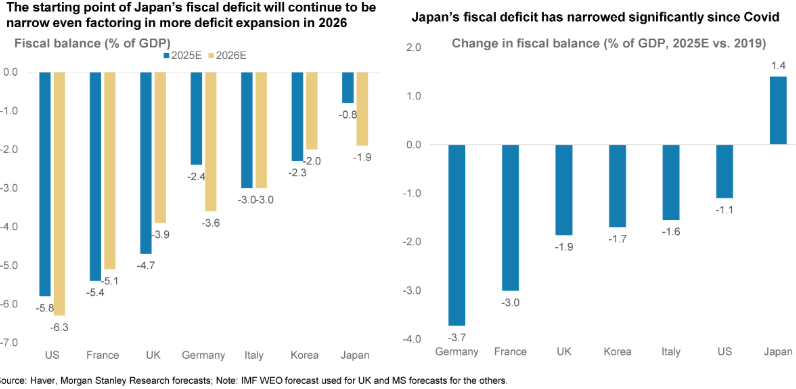
Meanwhile, Japan’s fiscal deficit isn’t as concerning as many may believe, and investor fears, in our view, are overdone. Japan’s fiscal deficit has actually narrowed in recent years and is now at just -0.5% GDP – the best gap in close to thirty years. Contrast this with the US, where the federal deficit is close to 6% of GDP, and the difference is striking.
 Source: Morgan Stanley
On a relative basis, Japan also beats many other developed economies. Pertinently, the deficit as % of GDP could narrow further this year relative to the RoW (rest of the world). Rising nominal GDP, spurred on by inflation and underlying growth in the economy, is going to raise the taxes received by the government. We also see the inflation coming through in Japan as helping the overall debt burden, because the government clearly will benefit as real debt levels are eroded away.
Source: Morgan Stanley
In addition, Japanese corporates also have lower levels of gearing than any other developed world stock markets (remember we talked about the huge cash pile earlier) and rising return on equity, which justifies a higher price to earnings multiples. Despite Japanese benchmarks being amongst the best performing, the PE multiple still trails the US by a significant margin.
Recently, both Morgan Stanley and JP Morgan reaffirmed their bullish outlook on Japan and see good prospects for the financials and banks, energy, construction, real estate, auto, and also AI/semiconductor sectors. We concur and see scope for both the Nikkei and TOPIX to sustain outperformance this year.
Rates Up, Pressure On
In Australia, the RBA lifted the cash rate by 0.25% on Tuesday to 3.85% in a unanimous decision that Governor Michele Bullock implied may not be the last. The board’s nine members voted without dissent to raise rates for the first time since 2023, citing persistent inflation that has proven more broad-based and stubborn than anticipated. The move creates immediate pain for Australians carrying mortgages.
Ms Bullock said last year’s stronger-than-expected recovery in household spending and business investment pushed demand beyond the economy’s sustainable capacity, particularly given deteriorating productivity. I believe government spending has also played a big role in reducing capacity within the economy – and pushing inflation higher.
Ms Bullock noted that “years of weak, to no, productivity growth is a big part of that story,” she said, acknowledging inflation was more entrenched than the bank initially assessed. GDP per capita in Australia has notably declined over the last decade, with the “work from the beach ethos” one headwind for productivity in my view.
Bondi Beach on a Monday
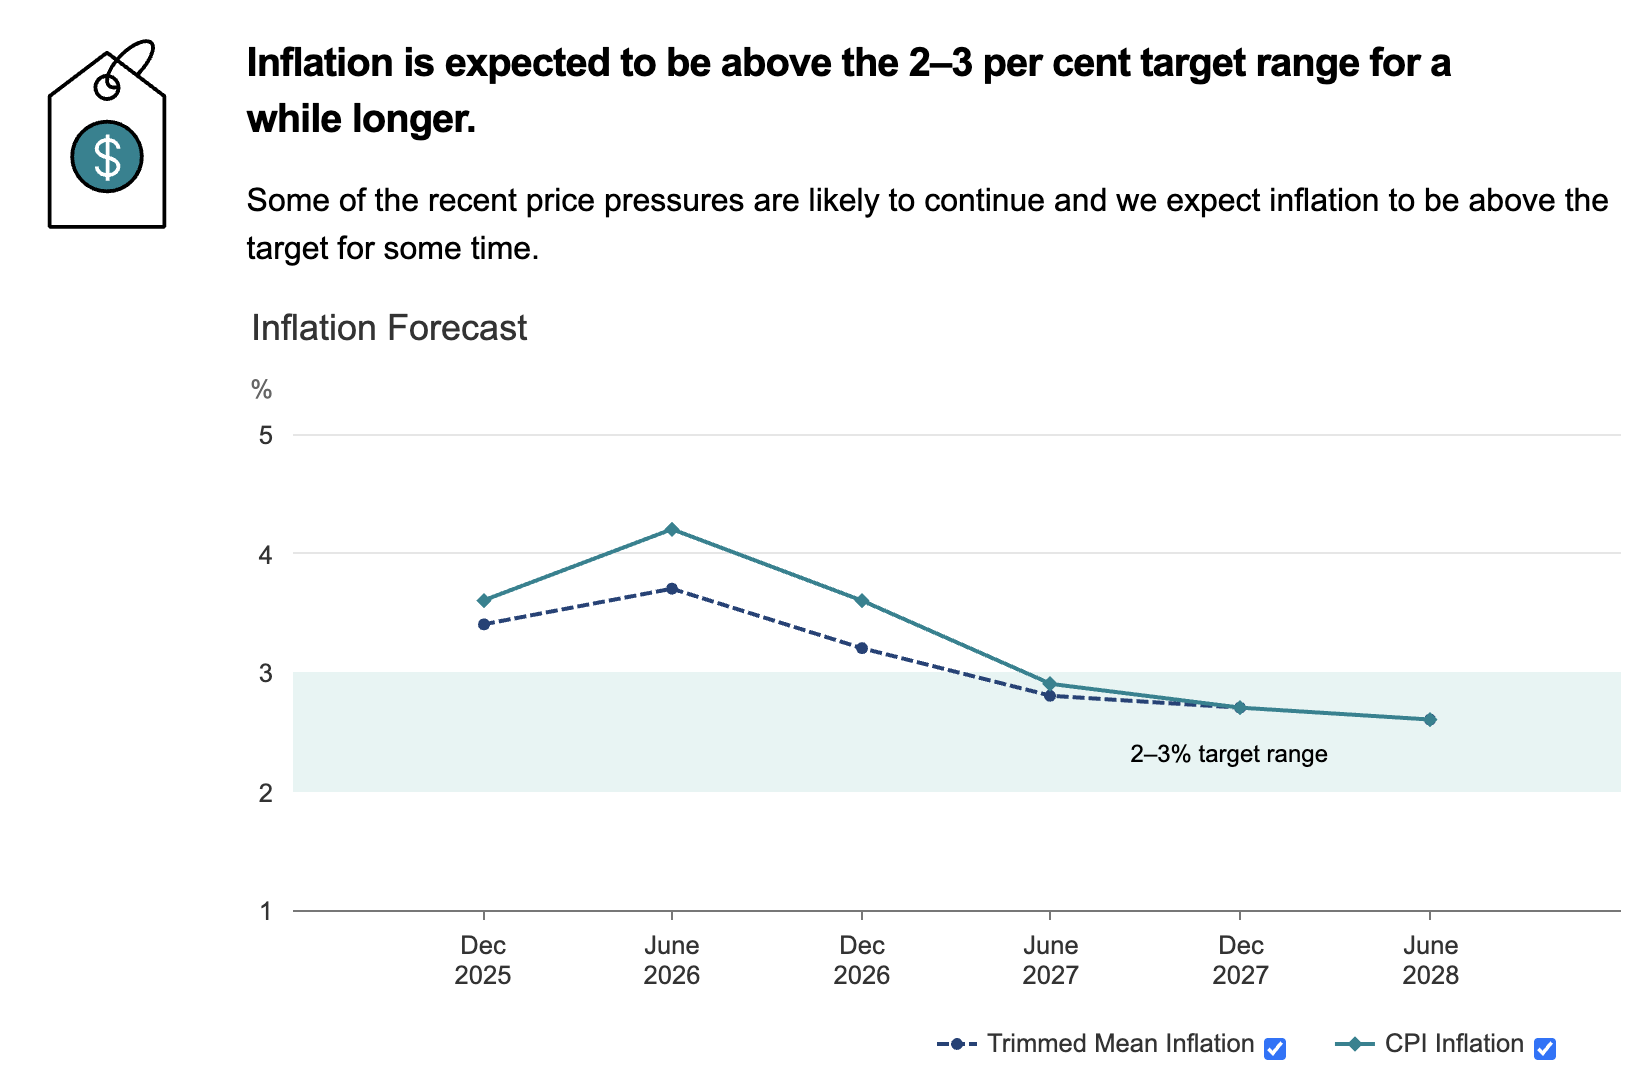
The RBA upgraded its inflation forecasts to be ‘materially higher,’ with the consumer price index now expected to rise above 4% by mid-year. It now expects trimmed mean inflation (the key figure to watch) to be 3.7% by June, up from a previous 3.2%, and 3.2% by December rather than 2.7%, with inflation not expected to return to the midpoint of the 2%–3% target band until mid-2028. If we don’t see some improvement in the coming months, this implies that at least one more rate rise is likely.
 Source: RBA
While Ms Bullock avoided direct criticism of government spending, she made clear that public sector outlays – now at a four-decade high as a share of GDP – are contributing to demand pressures the economy cannot absorb. I concur.
Still, the decision landed awkwardly for Treasurer Jim Chalmers. During question time, Mr Chalmers defended the government’s record, noting the RBA had not explicitly mentioned government spending as an inflation driver. Some economists were more pointed in their criticism, which we agree with.
In terms of the immediate impact, the Australian bond market reacted swiftly to the decision, with the three-year yield, which closely tracks expectations for the cash rate, jumping to nearly 4.4%, the highest level in more than two years. The moves were partially unwound late in the session as Reserve Bank governor Michele Bullock addressed the media. The yield eased back to 4.3% after investors judged her comments to be slightly less hawkish than the decision and accompanying statement had initially suggested.
Meanwhile, Commonwealth Bank moved swiftly to pass the increase through to mortgage customers, with Westpac and NAB following within hours. The Australian dollar rallied against the greenback to back above US70c.
What’s next? The critical question is whether Tuesday’s move represents a one-off adjustment or the start of a new hiking cycle. Ms Bullock hedged her bets (the normal and understandable playbook for central bankers in this tight spot!), saying, “I don’t know if it’s in a cycle. Certainly, it’s an adjustment.” That latter comment was what helped bond markets cool a little later in the day.
Economists remain divided. The AFR reported that NAB’s Sally Auld forecasts a second hike later in the year, while ANZ’s Richard Yetsenga argues yesterday’s move will slow consumer spending enough to prevent further tightening. Markets are pricing in at least one additional increase before year-end, with a relatively high probability of another hike by May. At this juncture, this seems fair.
Business leaders called for a curbing of government spending – I agree. Some business leaders are pressing the Albanese government to rein in spending to pre-pandemic levels, arguing cuts of more than $50 billion a year are needed to curb inflation pressures. This argument is well-founded.
The Australian Chamber of Commerce and Industry (ACCI) said in a pre-budget submission that spending on the $52 billion National Disability Insurance Scheme, childcare, aged care, health and defence should be wound back to make the budget sustainable and ease demand in an economy running close to capacity. ACCI chief executive Andrew McKellar warned that failing to control inflation risked undermining the government’s broader economic agenda, with higher interest rates and weak productivity hurting business conditions and future living standards. The ACCI wants spending capped at 25% of GDP, broadly in line with the pre-COVID decade.
Meanwhile, Treasury expects federal spending to hover around 27% of gross domestic product over the next two years, the highest level since 1986 outside the pandemic years, as the government grapples with rising welfare costs and the energy transition. Economists and industry groups say the inflationary impact of this spending is increasingly clear as public and private sectors compete for limited labour and inputs.
AMP chief economist Shane Oliver (whom I hold in high regard) argues that elevated public spending was constraining the private sector’s recovery by pushing the economy up against capacity limits and feeding through to higher prices. Mr Oliver argues that cutting spending back to more normal levels would free up space for private sector growth without higher inflation. Mr Oliver is one of the original economists of the modern Australian financial markets, with more than 40 years’ experience under his belt, becoming an influential voice and teacher of how economics and markets intersect.
Per AFR reporting, independent economist Chris Richardson said every $7.5 billion to $10 billion cut from annual government spending could potentially remove the need for a near-term rate rise, though he stressed that only ineffective spending should be removed, with any relief for the Reserve Bank a secondary benefit. The AFR quoted Mr Richardson as saying, “If you’re cutting spending, you shouldn’t be doing it because it avoids a rate rise. You should be doing it because the spending is not achieving much, and certainly for some of our spending, there is an excellent case to be made. Especially if at moments like now, you can take the pressure off the Reserve Bank. That’s the cherry on top.”
I think the economist makes some good points. There are many Australians who are struggling and need help. It is not about depriving these people, but rather trimming the government spending that simply isn’t effective and just adding to inflationary pressures. Granted, it isn’t an easy task, but one only needs to look at the housing crisis to see that many aspects of the economy can be handled more efficiently by the private sector to deliver better outcomes for the nation. Spending and policy need to work together, and one can argue in certain areas, like housing, that they are working at loggerheads.
Recent inflation data showed underlying inflation at 3.4% in the December quarter, well above the Reserve Bank’s 2% to 3% target band, which would have been one of the key data points that prompted the RBA to hike yesterday. Ultimately, I posit that the government is making the RBA’s task a good deal harder with some ineffective spending adding to inflationary pressures. However, a key element is poor productivity.
The Australian economy is ticking over, but not running so hard that one should expect the persistent inflationary pressures that are forcing the RBA’s hands. GDP growth was running at 2.1% annually in 3Q25, with expectations of about 2.4% later in the year, well below the long-run average of more than 3%. Recent per capita growth was just 0.4% on an annual basis (flat on QoQ), highlighting how population growth has been doing much of the heavy lifting while adding pressure to housing and infrastructure.
In addition, that 0.4% increase per capita annually in 3Q25 followed earlier declines in 2023 and 2024, which is, well…not great! After years of flattish earnings at the index level, I believe a boom in resources will provide upward support for the ASX200 in 2026 and beyond, but we need improved policies to broaden durable growth opportunities elsewhere to ensure a prosperous Australia for everyone.

Report spotlight
Betashares Japan ETF – Currency Hedged (ASX: HJPN)

Japanese equities have reached record highs in early 2026, yet the momentum appears far from exhausted as the country emerges from three decades of deflation through a fundamental transformation in both fiscal policy and corporate behaviour. Contrary to widespread concerns about Japan’s elevated debt-to-GDP ratio, the underlying fiscal reality is robust. The deficit has narrowed to just -0.5% of GDP, the healthiest gap in close to thirty years and starkly superior to the approximately 6% federal deficit in the United States. For the first time in decades, Japan’s nominal GDP is growing faster than its debt issuance, causing the debt-to-GDP ratio to actually decline through the “denominator effect.”
Prime Minister Sanae Takaichi’s “Sanaenomics” is rewriting the macro playbook through targeted stimulus. The ¥21.3 trillion package approved in late 2025 directs ¥11.7 trillion toward household support to underpin consumption, while ¥7.2 trillion targets strategic sectors including defence, semiconductors, and “Physical AI.” By effectively subsidising corporate capital expenditure, these measures should drive higher returns on equity and invested capital. The February 8th snap election is likely to deliver a strong mandate, clearing the political runway.
Meanwhile, Tokyo Stock Exchange reforms have evolved beyond compliance to “Capital Efficiency 2.0.” The record ¥115 trillion corporate cash pile is fuelling unprecedented shareholder returns. Buybacks hit ¥18 trillion in 2024 and trended materially higher in 2025, accompanied by accelerating M&A, management buyouts, and strategic divestments designed to maximise ROE. This structural shift is surfacing hidden value, making the Nikkei’s advance toward 54,000-56,000 appear a rational re-rating rather than speculation.
The technical picture is supportive. Last October, we said that “HJPN has broken out to new all-time highs to presently trade around $28.50. The ETF remains in a well-defined uptrend with significant support at $21.68. We believe Japanese equities are in a new bull market that could run for many years.”
HJPN has made new record highs since our last update. The ETF remains in a well-defined uptrend with significant support at $22 and higher at $26. We believe that HJPN will make new record highs this year, which is consistent with our bullish outlook for Japanese equities.

Valuation concerns seem overblown. While the Nikkei sits just 25% above the 1989 peaks. Japanese corporates also carry lower gearing than any other developed market while delivering rising ROE. For Australian investors concerned about currency volatility, the Betashares Japan ETF (HJPN) strips out FX noise through systematic hedging. We rate HJPN a BUY.
Sumitomo Mitsui Financial Group (JP: 8316)
For those preferring a more targeted approach to a pocket of the Japanese we are very bullish about, monetary policy normalisation is a very powerful tailwind for the banks. Sumitomo Mitsui Financial Group has delivered results that confirm Japan’s second-largest megabank is entering a sustained, higher-profitability phase rather than enjoying a cyclical windfall. Nine-month net profit reached ¥1.395 trillion, up 23% year-on-year, putting the group within striking distance of its full-year target of ¥1.5 trillion.
The drivers are broad-based. Gross profit for the first three quarters increased roughly ¥431 billion to ¥3.59 trillion, while net business profit before credit costs rose ¥342 billion to ¥1.80 trillion. Net interest income at core subsidiary SMBC climbed ¥232 billion to ¥1.41 trillion. Crucially, cost discipline remains intact. Group-wide expenses increased ¥126 billion to ¥1.90 trillion for the nine months, but the overhead ratio still improved more than three percentage points to 52.9% as top-line growth outpaced spending.
In our last tech update on the 18th of November, we noted that “Sumitomo Mitsui Financial Group has made a twenty-year record high above ¥4,500. We have also made a number of buy calls on Japan’s TOPIX bank index and still see upside within the sector. SMFG has risen within a consistent primary uptrend for the past several years, and has since cleared important resistance levels at ¥4,000 and ¥4200 to make new record highs. Scope remains open for upside extension in our view over the coming year. The near-term risks some consolidation, but we retain a bullish outlook on SMFG and Japanese financials generally.”
Since our last update, Sumitomo Mitsui Financial Group has surged to new record highs above ¥5,700. SMFG has risen within a consistent primary uptrend for the past several years, but at some point will likely encounter resistance and consolidate. However, there is no evidence yet to emerge on the charts that suggest a correction is imminent. Meanwhile, support now resides below at key levels near ¥5,400 and ¥4,800. Scope remains open for upside extension over the coming year in our view. While the near-term outlook still risks some consolidation, we retain a bullish outlook on SMFG and Japanese financials generally.

Asset quality remains manageable. The capital story strengthened further. Net assets rose to ¥15.8 trillion, up nearly ¥1 trillion since March, while the group booked ¥333 billion of gains on equity stake sales and completed a ¥150 billion buyback in late January. President Toru Nakashima now suggests a ¥2 trillion consolidated net profit could arrive by fiscal 2026-2028, years ahead of the previous around-2030 timeline. With shares trading below global peers on price-to-book and earnings multiples despite record profits and credible prospects of approaching ¥2 trillion net income later this decade, we maintain our BUY rating on SMFG, especially for members without exposure.
Apple
Apple’s fiscal first quarter showcased the enduring strengths of this tech titan, though, with a full valuation, we suggest patience for new investors. The company posted $143.8 billion in revenue (up 15.7%), smashing expectations, with diluted earnings per share climbing 18.3% to $2.84 versus consensus estimates of $2.67. Gross margin reached an impressive 48.2%, exceeding the 47.5% forecast, with product gross margin improving 140 basis points to 40.7% and services gross margin rising 150 basis points to 76.5%.
iPhone revenue surged more than 23% to $85.3 billion, representing 59% of total sales in what management called an “iPhone best-ever quarter.” Services delivered a record $30.0 billion, up 14%, demonstrating ongoing value from an installed base exceeding 2.5 billion active devices – an enormously valuable platform for continued monetisation. Operating margin expanded 90 basis points to 35.4% despite a significant R&D ramp, with operating income climbing 18.7% to $50.9 billion and net income increasing 15.9% to $42.1 billion.
Geographically, the standout was Greater China at $25.5 billion (up 37.9%), likely reflecting iPhone 16 momentum and share gains, while Americas delivered $58.5 billion (up 11.2%) and Europe contributed $38.1 billion (up 12.7%). Importantly, growth was not concentrated in a single region despite China’s outperformance. The company deployed approximately $32 billion in capital return during the quarter, including $24.7 billion in share repurchases. Management guided for current-quarter revenue growth of 13-16% but flagged constrained iPhone supply and rising memory prices as near-term risks.
In our last technical comment in mid-November, we said that “Apple has made new record highs above $270 since our last technical update back in August. The technical setup for Apple remains skewed to the bull side, with no evidence that the longer-term upward trend will not continue. Support is now well defined at the January highs near $250. Upward momentum appears to be resuming once again, and we anticipate additional upside extension into new record territory over the coming six months.”
Since our last update, Apple made new record highs above $290, with the technical setup remaining firmly ensconced on the bull side. There is no evidence yet to emerge that points to the longer-term upward trend ending, which is consistent with our bullish outlook for US stocks. Support is now well defined at last year’s highs near $260 and further below at $240. Upward momentum appears to be resuming once again, and we anticipate additional upside extension into new record territory above $290 over the course of this year.

For existing holders, this quarter provides no reason to reduce exposure. However, at approximately 33 times forward earnings, the valuation reflects well-understood strengths and leaves limited room for multiple expansion. We maintain a HOLD rating on Apple.
Genesis Minerals (ASX: GMD)
Genesis Minerals delivered record quarterly production of 74,261 ounces at an all-in sustaining cost of A$2,635 per ounce, but the real story lies in what surging gold prices did for profitability. The company received an average A$6,057 per ounce for its gold sales, up 17.7% quarter-on-quarter, driving revenue 11.8% higher to A$432.2 million despite sales volumes declining 5% to 71,346 ounces due to timing differences. The implied margin expanded dramatically with a 31% improvement in unit profitability in a single quarter.
Strong pricing drove A$231 million of mine operating cash flow, up 28.9%, enabling management to repay A$100 million of corporate debt, leaving the company with zero bank debt, and invest A$76 million in growth projects and exploration. Cash and equivalents ended the quarter at A$403.6 million.
The next catalyst is Tower Hill, a shallow high-grade deposit containing 15 million tonnes at 2.0 grams per tonne for 1.0 million ounces in Probable Reserves, located just one kilometre from the Leonora mill. Management brought forward investment. The company maintained guidance of 260,000-290,000 ounces at A$2,500-2,700 per ounce all-in sustaining cost.
Since our last update, Genesis has surged to new record highs well above $8. The stock now looks near-term overbought with correction risks running high. Key support levels now reside at $7, $6 and $5, while overhead resistance at the record highs above $8.40 can be expected to now intensify. Looking out over the medium to longer term, our base case remains for new highs to ensue for Genesis this year, given our bullish case for gold. But buyers should stand aside for now, with a correction overdue. Note that we have seen a correction play out over the past weekend, with GMD and its peers staging a decent rebound today (Wednesday). However, we expect volatility to remain elevated in the short term.

After a significant re-rating and with gold pricing volatility elevated, we rate Genesis Minerals a HOLD.
Whitehaven Coal (ASX: WHC)
Whitehaven Coal’s December quarter demonstrated a smoother-than-expected integration of the Queensland metallurgical assets, with volumes and costs both tracking ahead of market expectations. Managed run-of-mine output lifted 21% quarter-on-quarter to 11.0 million tonnes, underpinning equity sales of produced coal of 7.0 million tonnes, up 18%. The company has now delivered 20.0 million tonnes of managed ROM across the first half of fiscal 2026, providing what management describes as a “solid foundation” for a stronger second half as cost-out programs mature.
Pricing moved in the company’s favour. The December quarter average price on equity coal sales was approximately A$190 per tonne, up slightly from A$188 per tonne in the first quarter, with Queensland operations realising around A$225 per tonne and New South Wales A$163 per tonne. By revenue, the sales mix was roughly 53% metallurgical and 47% thermal coal, underscoring the quality of Whitehaven’s product suite.
Cost performance proved another bright spot. Unit cost of coal landed at the low end of fiscal 2026 guidance, supporting an expected first-half unit cost of roughly A$135 per tonne excluding royalties, well within the A$130-145 per tonne band. Management reiterated the company remains on track to remove A$60-80 million of annualised costs from the business by June 30, 2026. Net debt fell from approximately A$0.8 billion at September 30 to roughly A$0.7 billion at December 31, 2025, while liquidity sat near A$1.5 billion. The on-market share buyback continued at a measured pace, with 6.3 million shares repurchased in the first half for A$45 million.
In our last tech update on the 27th of October, we noted that “After breaking out above resistance at $6, Whitehaven has risen to retest the primary downtrend in place since the record high at $11.20 was attained back in late 2022. Our base case technical view remains for WHC to soon break out above the primary downtrend, which now intersects at $7.13. This outcome would confirm an exit from the extensive corrective pattern in place for the past several years. Once confirmed, WHC has significant recovery potential and technical upside in our view.”
Since our last update, our base case technical outlook has played out. Whitehaven has fully inflected and extended higher above $9 after breaking out above a three-year primary downtrend. Our base case is for WHC to retest the record highs above $11 sometime this year.

With structurally constrained seaborne met coal supply, high-quality assets, and improving fundamentals, we maintain our BUY recommendation on Whitehaven Coal, particularly for members without exposure seeking leverage to resilient Asian demand.
All these reports and many others spanning Australasia, Mining and Global Equities are available online for your reading pleasure. Links to the different landing areas for Members are at the bottom of the FatWrap.
Have a great weekend
Carpe Diem
Angus